Just how bad is it?
There has recently been some news regarding a report by 18 scientists from the Stockholm Resilience Centre who show that the resources we take from the environment and the changes we are making to our atmosphere, forests and the oceans are putting the planet under extreme distress.
Our plundering of the planet’s natural resources is so extreme that four boundaries have already been crossed.
Sarah Cornell one of the Authors said "Four boundaries are assessed to have been crossed, placing humanity in a danger zone," a statement said of the study in the journal Science, pointing to climate change, species loss, land-use change and fertilizer pollution. Of a total of nine boundaries assessed, freshwater use, ocean acidification and ozone depletion were judged to be within safe limits. Others, including levels of airborne pollution, were yet to be properly assessed.
To get an idea of the overall picture it is useful to look at the big numbers.
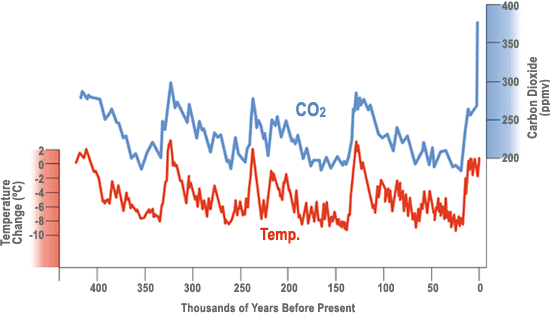
This graph clearly illustrates how much CO2 we have put into the atmosphere and gives a clue to how far the temperature will rise before it reaches equilibrium.
The climate scientists working in this field believe we are already committed to a 2C temperature increase and at least a 12 metre sea level rise. To put this into perspective, we have already raised the temperature 0.8C, we are trying to limit the increase to 2 C and at 3 C it will be a major disaster for humanity.
With the resistance to change exhibited by the American business world, the media and the politicians it will be a long time before we can stop the output of CO2 and slow down the worst of the greenhouse gas emissions.
I noticed in the reports in American newspapers that they had a quote from a scientist who said that the world had suffered similar disasters in the past and had recovered, failing to mention that there were no people on the planet at the time. If you had just lost your children in a war over resources, could not afford the food you need and had to share your house with five other families, they would not be so complacent.
The planet will go on spinning whether we are on it or not but we want to preserve our standard of living and lifestyle
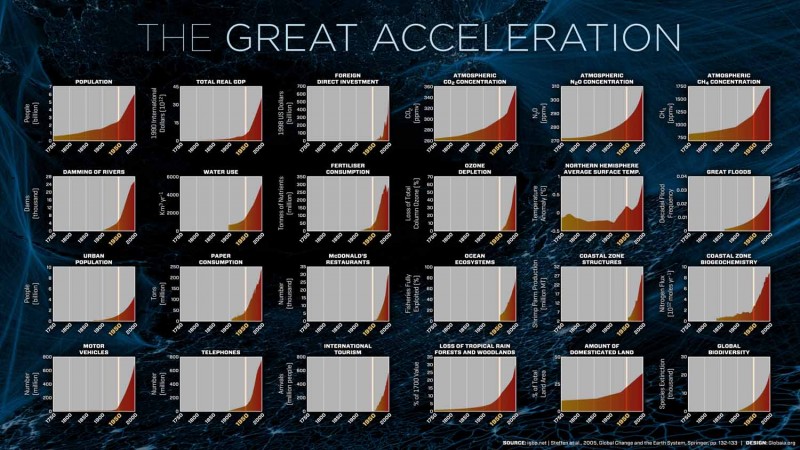
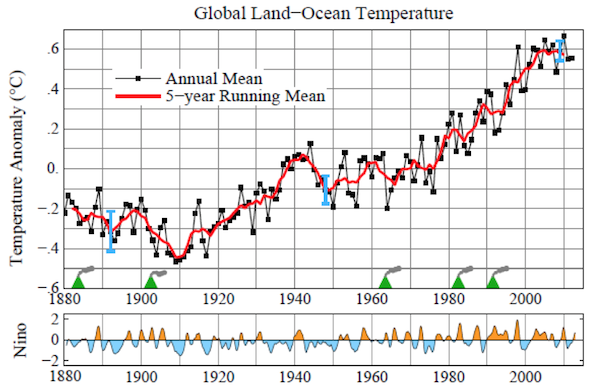
This is the chart of the vital signs of the planet.
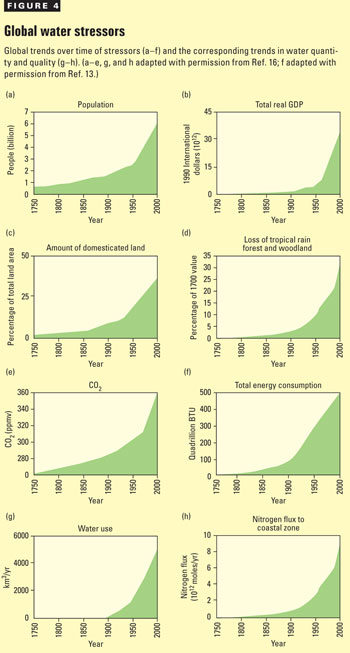
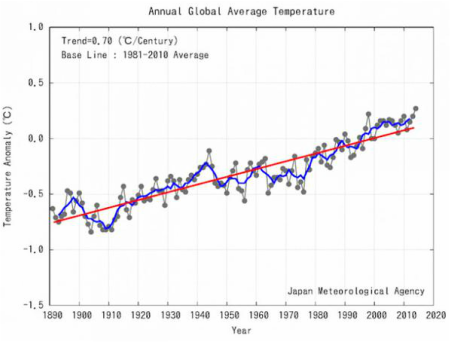
Here is a similar set of graphs from another source
We now have 7 billion on the planet and as the temperature rises our output of food production will fall, sea levels will flood infrastructure and displace millions of people who will then be looking for food and safety, the natural environment on which we rely for so much will be failing, including our oceans which provide fish and the weather will be unpredictable and probably violent.
The rich countries currently believe that these disasters will only happen to poor, far away countries but this is a whole of planet event and there will be civil strife and mass movement of people that will disrupt every economy on the planet.
The rich countries currently believe that these disasters will only happen to poor, far away countries but this is a whole of planet event and there will be civil strife and mass movement of people that will disrupt every economy on the planet.

 RSS Feed