Climate Outcome NZ
  • Climate Outcome. Home page.
  • Latest posts & news
  • Temperature
  • Precipitation changes in a warming world.
  • Increased flood damage in a warming world.
  • Drought
  • Wind
  • El Nino Southern Ocilation. ENSO.
  • Sea Level
  • Polar melting
  • Arctic sea ice + weather.
  • West Antarctica
  • Ocean Acidity
  • Plant Die Back. Animal Migration.
  • Climate threats
  • Streams a vital resource.
  • Clean energy alternatives.
  • Climate Change in the Bay of Islands
  • The Author. Bob Bingham.
  • Satellite accuracy.
  • Reference sites

Bob Bingham Blog page.

A series of opinion pieces on, mostly climate change and related subjects to do with New Zealand.

Back to home page.

IPCC Scenario’s Explained

26/2/2016

1 Comment

 
Picture
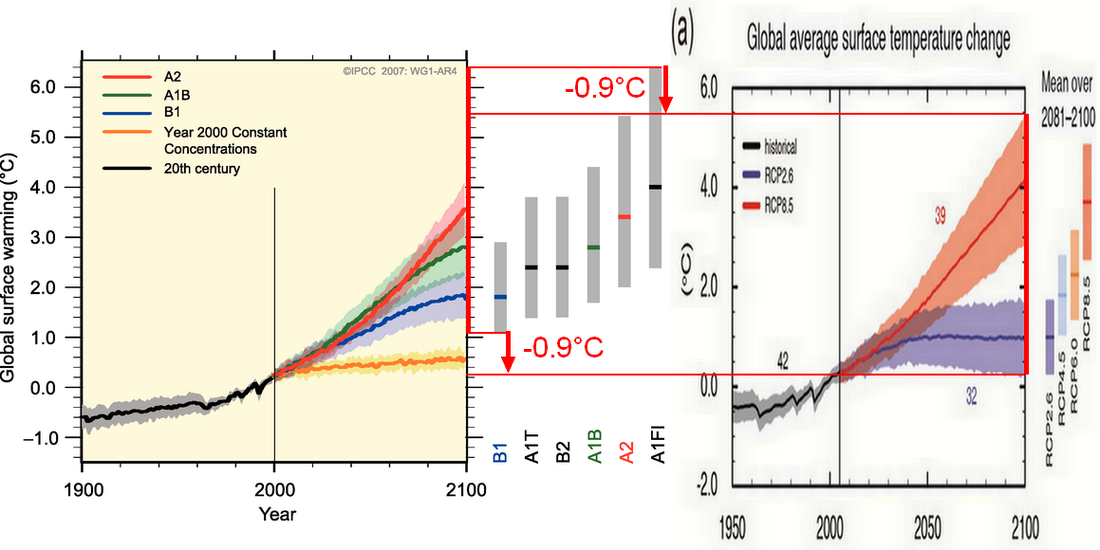
When the IPCC make a forecast about future temperatures or sea level rise there is always a very large range of uncertainty, which makes it all look as though the science was not very clear or settled, but this is not the case at all.
The problem is that climate scientists do not know what we, the human race, are going to do with regard to our greenhouse gas emissions. To get a range of options the climate scientists went to sociologists and asked them to work out what was possible and what might happen and the result was a series of four pathways that we might follow.
The chart above, on the right, shows the two extreme options in dark blue (RCP2.6) and dark red (RCP8.5) and the two intermediate are shown in the far right column in light blue (RCP4.5) and light red (RCP6.0).
The RCP2.6 etc. are the Representative Concentration Pathway and the numbers refer to the Watts per square meter of climate forcing. The numbers themselves are not a lot of help but the scenario enables us to understand where we are going. 

We are currently tracking above the worst case scenario, but let us look at what we need to do to meet the best scenario of RCP2.6.  We would need to stop producing CO2 by ceasing to burn coal and oil almost immediately and improve our farming techniques by reducing our cattle herd by three quarters, eliminate waste so that we ate everything that we grew, and this might cut our farming by one third. We would have to actively try to remove CO2 from the atmosphere by planting vast forests on land that we have cleared, and we might try industrial sized effort to remove CO2 from the atmosphere.
You can stop smiling because that is clearly not going to happen and that means that you can remove the bottom part of any range of options.
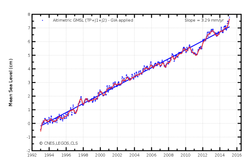
The next option is RCP4.5 which is what most people would consider an extreme change to our lifestyle, achievable but highly unlikely and I think we can safely remove the second level of uncertainty. This leaves us with the more realistic RCP6.0 and RCP8.5 which makes it a lot easier to read the graphs and here is one from NOAA on sea level rise using the IPCC criteria.
Picture
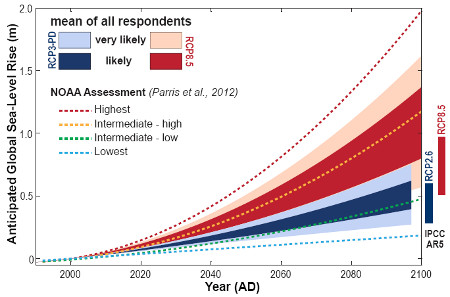
The graphs are now much easier to read because you can eliminate the blue parts of the graph and look at the red and yellow dotted lines. Even here there is uncertainty but this time it is a scientific one and it involves the sudden collapse on an ice shelf. This would be a massive event and not enough is known about the ice shelves to make a forecast so it was deliberately excluded.
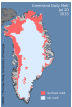
There will almost certainly be a sudden collapse of one or more ice shelves before the end of the century so your guess as to the timing and the result is as good as anyone else.

Ocean Acidity.
Picture
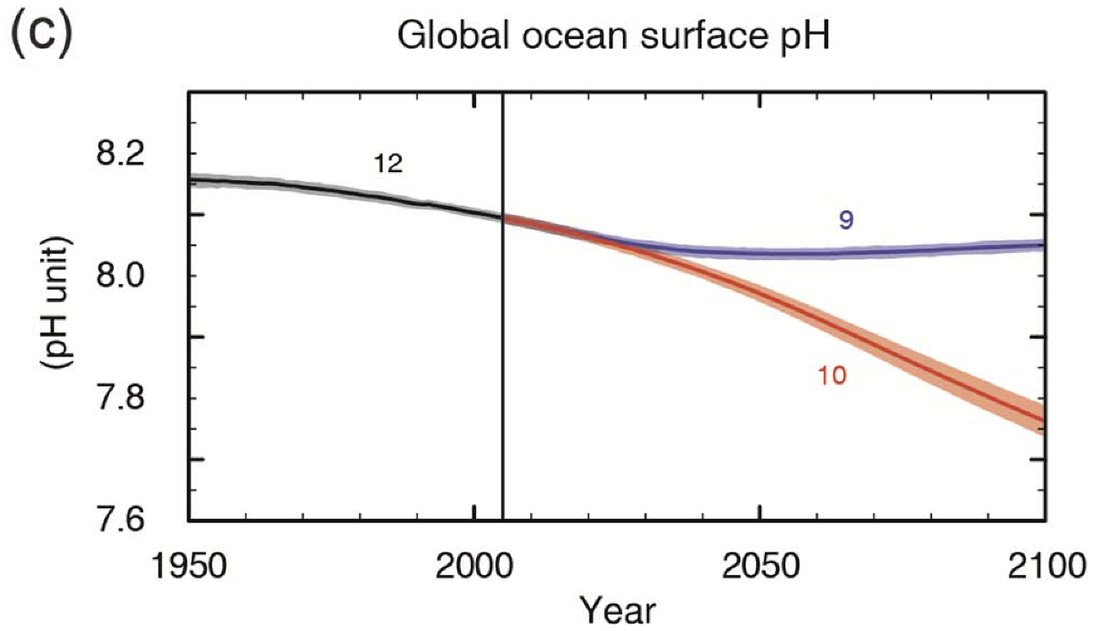
Another awkward chart to read is the ocean acidity where, counter intuitively, as the acidity of the ocean increases the pH number gets smaller. In this case we start out today with a pH number of 8.2 and by the end of the century it could be 7.7 which is widely believed to be beyond the reproductive capability of phytoplankton, shell fish and coral.
1 Comment

Sea level rise trends

13/2/2016

3 Comments

 
Picture
A recent report on research by J. T. Reager using NASA's GRACE satellite shows that increased heavy rainfall, caused by the atmosphere being able to hold more water in a warmer planet, has resulted in more water being stored on land and has reduced the effects of sea level rise.
The chart below shows a big dip in 2012 when the floods in Pakistan and Australia held water on land for a while but of course it made it's way to the sea in the end.

Picture
As can be seen in the chart, sea level has recently been rising at a much faster rate and must be approaching 5 mm a year. There are more reports from Greenland that the rate of melting ice is accelerating and the combination this and other related factors is making sea level rise something that is becoming an urgent problem.

The chart below shows the coastal regions that are at risk from sea level rise and recent events are making the critical one metre rise closer and closer in time.
Picture
Looking at Europe in closer detail you can see the catastrophic loss of land and infrastructure. The East coast of the USA from New Orleans to New York will also suffer dramatic losses, as well as China.
Picture
The economic losses of such a huge amount of infrastructure will bankrupt even the richest economies and the displacement of many millions of people will cause civil strife that will make Syria look like a Sunday school outing.
3 Comments

CO2 Emitters and climate change.

9/2/2016

0 Comments

 
Picture
A recent report highlights the problems the big CO2 emitting nations are causing the poorer and developing nations by changing the climate.
The difference between the USA, China and India is quite stark as this World Bank chart shows. The USA has a per capita output of CO2 of around 18 tonnes, China, New Zealand and also the European Union are around  6.5 tonnes and India is down at 1.5 tonnes.
​If China reaches the per capita CO2  tonnes.missions of the USA it will be all over so lets hope that they are sincere and successful in their declared intention of changing their energy source.

 .  
0 Comments

Changes in atmospheric circulation.

4/2/2016

1 Comment

 
Picture
Global warming or climate change implies higher temperatures and a warmer climate but in fact the real problem is getting weather that we are not accustomed to whether it be hotter or cooler or wetter or dryer. 

Picture
There are major temperature regions that have always been fixed and they influence the flow of atmosphere around the planet but some of these are now changing. Just to name a few of the big ones, there is the loss of arctic ice, the cold patch in the North Atlantic, the warm patch in the North Pacific, the lowering of the salinity of the North Atlantic and of course the increase in Arctic temperatures that is three times the global average. This has nothing to do with El Nino which may just accentuate the whole situation.

Picture
The problem here is not so much the science that gives cause and effect, but the results that have been experienced. One result that has been noticed is the change in the Jet stream and whether it was caused by the reduced Arctic sea ice, as Jennifer Francis believes, or the extra heat in the Pacific Ocean, as Kevin Trenberth believes, is open to debate but the result is that the jet stream is making much deeper waves and is slowing down.
The slower jet stream gets stuck and has caused a heat wave in Europe that killed 60,000 people, a drought in Russia that destroyed the grain harvest, drought in California and really cold winters and floods on the USA East coast.

Picture
Fast melting of the ice on Greenland has caused a lowering of salinity in the North Atlantic and the cold patch of ocean in the same place. This combination has resulted in a slowing of the Gulf Stream with the resulting increased heat on the American East coast and a bending of the North East air flow across the Atlantic to change the course of the weather streams. The result has been some very powerful storms on the American East coast such as Sandy and the recent heavy snow storm and also the major UK floods in 2012 and 2015.

The warm water, Blob in the North Pacific has caused the drought in California and probably the unseasonal floods in the Mississippi.
Picture
The increased acidity of the oceans as it absorbs the extra CO2 from the atmosphere is causing a reduction in phytoplankton of 30% to 40%and consequential reduction in the base of the food chain. The mass deaths of sea birds and whale stranding’s may or may not be linked to the loss of food but many people are drawing conclusions.
These long forecast outcomes are just starting to happen but we need to very aware that these are not isolated events and are all linked and caused by our changing planet. 

1 Comment

Sea level rise 2016

3/2/2016

0 Comments

 
Picture
With the 2015 sea levels now in we can see how the latest four year trend has a steep upwards gain.
This must be nearer 5 mm per year and shows that the whole situation is becoming unstable.

0 Comments

    Bob Bingham 

    Occasional blog posts on topical news items concerning the climate.  Please click the RSS feed to receive updates.

    Picture

    Archives

    January 2023
    November 2022
    June 2022
    May 2022
    May 2021
    May 2020
    April 2020
    March 2020
    September 2019
    December 2018
    April 2018
    March 2018
    January 2018
    December 2017
    September 2017
    June 2017
    April 2017
    March 2017
    February 2017
    January 2017
    December 2016
    November 2016
    October 2016
    August 2016
    July 2016
    June 2016
    May 2016
    April 2016
    March 2016
    February 2016
    January 2016
    December 2015
    November 2015
    October 2015
    September 2015
    August 2015
    July 2015
    June 2015
    May 2015
    April 2015
    February 2015
    January 2015
    December 2014
    November 2014
    October 2014
    September 2014
    August 2014
    July 2014
    June 2014
    May 2014
    April 2014
    March 2014
    February 2014
    September 2013
    May 2013
    April 2013
    March 2013

    RSS Feed

    Categories

    All
    Clean Water
    Climate Change.
    CO2 Levels
    El Nino
    Floods
    Methane
    Ocean Acidity
    Pine Island Galacier
    Sea Level Rise
    Soil Loss
    Storms

    RSS Feed

Proudly powered by Weebly