Climate Outcome NZ
  • Climate Outcome. Home page.
  • Latest posts & news
  • Temperature
  • Precipitation changes in a warming world.
  • Increased flood damage in a warming world.
  • Drought
  • Wind
  • El Nino Southern Ocilation. ENSO.
  • Sea Level
  • Polar melting
  • Arctic sea ice + weather.
  • West Antarctica
  • Ocean Acidity
  • Plant Die Back. Animal Migration.
  • Climate threats
  • Streams a vital resource.
  • Clean energy alternatives.
  • Climate Change in the Bay of Islands
  • The Author. Bob Bingham.
  • Satellite accuracy.
  • Reference sites

Bob Bingham Blog page.

A series of opinion pieces on, mostly climate change and related subjects to do with New Zealand.

Back to home page.

How big are the areas of uncertainty in the IPCC Fifth report?

19/7/2014

6 Comments

 
The IPCC report on climate change is the gold standard as it is the distilled result of thousands of the top climate scientists in the world. Its weakness is that it can only report what can be definitively proved at the time the report is written and also, the projections of the worst case scenario, RCP 8.5, are so bad that there is not much research to say what the result would be if it actually happened.

There is a quote from Donald Rumsfeld explaining the reasons for invading Iraq without evidence which is more appropriate for the unpredictability of climate change. ‘There are known knowns. These are things we know that we know. There are known unknowns. That is to say, there are things that we know we don't know. But there are also unknown unknowns. There are things we don't know we don't know.’

I also like the quote from Mike Tyson. ’Everyone has a plan until they get punched in the mouth.’

We are making big changes to our planet and even the last ten years have shown us that we are not prepared for the sudden changes that have happened. The Arctic ice was not supposed to melt for many years yet, and the big changes to the jet stream that have caused chaos in the USA, the UK, Germany, Russia and China were not forecast at the start of this century.

Here are two areas that point to an uncertain future but I am sure that they are not the only ones.
Picture
CO2 emissions.

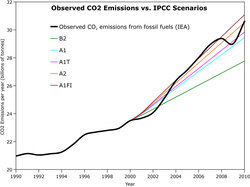
This chart from the International Energy Agency overlays the real CO2 levels over the IPCC forecast scenarios from 2000.


The above chart from the International Energy Agency shows how CO2 emissions have always been at the top end of IPCC projections apart from during times of recession.

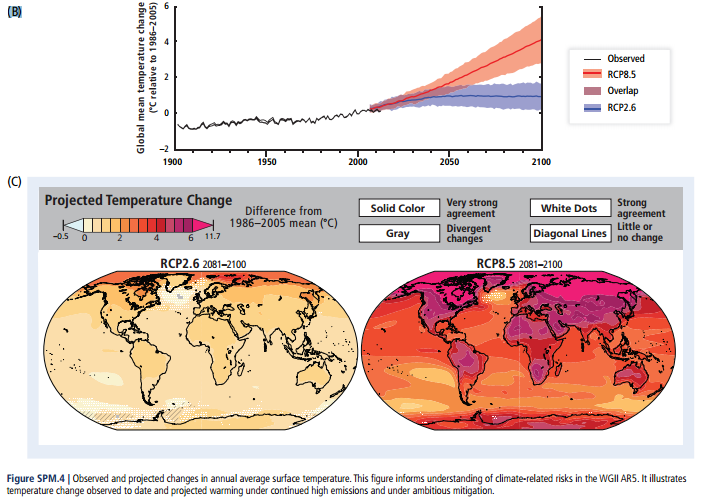
The IPCC Fifth report shows an RCP8.5  scenario that probably reflects the reality of the political state of the world. In other words, ‘Business as usual’.


Picture
The above chart illustrates the problems. Most productive areas of the world are showing temperature increases of 4C to 6C at which level, food production as we know it cannot take place. The likely result will be substantial food shortages which in turn will precipitate civil unrest and war. Predicting war is impossible so it can be classed as an unpredictable tipping point.

Sea level rise.

Sea level rise has a lot of predictable components such as thermal expansion and the melt rate of ice for given temperatures. What cannot be calculated is the result of catastrophic collapse of an ice shelf or the sudden disintegration of land based glaciers in Greenland or West Antarctica.

This dilemma is illustrated by the Real climate website appraisal of the IPCC Fifth repot.
http://www.realclimate.org/index.php/archives/2013/10/sea-level-in-the-5th-ipcc-report/

Here are some extracts which are in turn includes extracts of the IPCC report.

‘The range up to 98 cm is the IPCC’s “likely” range, i.e. the risk of exceeding 98 cm is considered to be 17%, and IPCC adds in the SPM that “several tenths of a meter of sea level rise during the 21st century” could be added to this if a collapse of marine-based sectors of the Antarctic ice sheet is initiated. It is thus clear that a meter is not the upper limit’.


- See more at: http://www.realclimate.org/index.php/archives/2013/10/sea-level-in-the-5th-ipcc-report/#sthash.ADBKTBhu.dpuf

‘In the latest assessment report of the IPCC we did not provide such an upper limit, but we allow the creative reader to construct it. The likely range of sea level rise in 2100 for the highest climate change scenario is 52 to 98 centimetres (20 to 38 inches.). However, the report notes that should sectors of the marine-based ice sheets of Antarctic collapse, sea level could rise by an additional several tenths of a meter during the 21st century. Thus, looking at the upper value of the likely range, you end up with an estimate for the upper limit between 1.2 meters and, say, 1.5 meters. That is the upper limit of global mean sea-level that coastal protection might need for the coming century’

 See more at: http://www.realclimate.org/index.php/archives/2013/10/sea-level-in-the-5th-ipcc-report/#sthash.ADBKTBhu.dpuf

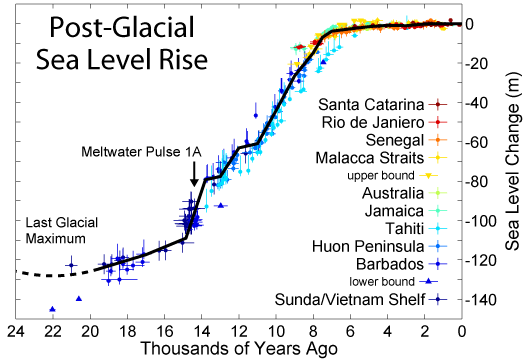
The world has experienced meltwater pulses in the past when the conditions have been right.


Picture
Melt water pulse 1A showed an increase level of twenty meters in four hundred years, or four metres every one hundred years, or one metre every twenty years.

With eleven of the world’s fifteen biggest cities at one metre above sea level plus big areas of productive farmland the economic consequences of sea level rise are incalculable.  


‘Everyone has a plan until they get punched in the mouth’


6 Comments

The earth’s atmosphere and CO2.

6/7/2014

0 Comments

 
Picture
Putting the atmosphere and CO2 into simple terms.


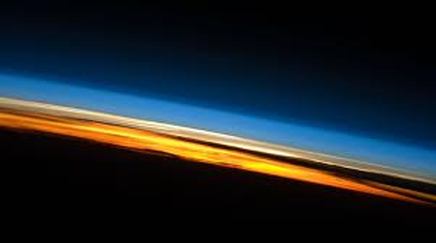
This is a picture of the atmosphere taken from space and the Troposphere, which is the part we live in, is the light blue section. The Troposphere is roughly ten thousand metres thick and at the top of it the temperature, where passenger jets fly, is about -54C. Not a place where we humans can live.

Picture
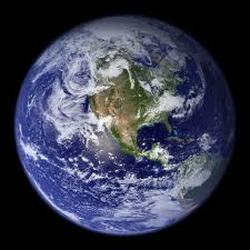
The earth is 12,500 kilometres in diameter and if we convert the scale of the earth and its atmosphere to millimetres and knock of all the noughts, to reduce the scale to a manageable size, the earth would be 1250 millimetres and the atmosphere 1 millimetre.


 For those not familiar with the metric system 1,250 mm is roughly from the tip of an outstretched left arm to the elbow of the right arm and 1 mm is the thickness of your finger nail.
So far as the atmosphere is concerned, there is not much of it.


To illustrate our habitable region a bit further.
Picture
 The tree line in the mid latitudes is at about 2000 metres and the temperature there is 0C and above that nothing much grows. We humans and most of the creatures and plants live in the warmer region below 1000 metres. Out of a very skinny troposphere we live in the bottom 10%.
Picture
Greenhouse gasses.
Greenhouse gasses warm the earth and it’s just as well they do because the world would be 35C colder than it is today. Water vapour is the biggest greenhouse gas and makes up 2% of the atmosphere and CO2 makes up only 0.04% at 280 parts per million. The problem for us is that CO2 is the main driver of change and we are producing a lot of it by burning fossil fuels.


According to the International Energy Agency http://www.iea.org/   in 2012 we put 32,578,641,000 tons of CO2 into our skinny atmosphere by burning fossil fuels alone. This started in about 1750 with the burning of coal but the big numbers started after World War 2, in about 1950, and the amount has increased steadily and continues to grow at 2 points a year. 

Picture
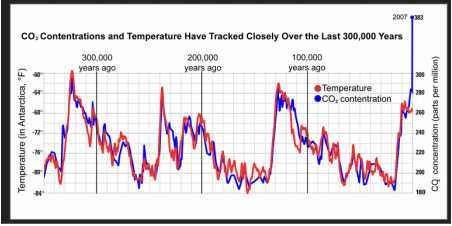
The chart above illustrates the growth of CO2 from its normal range of 180 ppm to 280 ppm to the current figure of 400 ppm.
The problem for our civilisation, as we know it, is that the world has not had 400 ppm of CO2 in the atmosphere for 3.5 million years and the plants and animals alive today are not equipped to live in the temperatures associated with this new level.
 We are committed to a sea level rise of 12 metres and a temperature increase of 3C and this is not a good scenario for us with seven billion people on the planet.

To understand how the natural ice ages and warm periods happen.  http://globalwarmingsimplified.weebly.com/

The threats to our way of life.  http://www.climateoutcome.kiwi.nz/climate-threats.html


0 Comments

    Bob Bingham 

    Occasional blog posts on topical news items concerning the climate.  Please click the RSS feed to receive updates.

    Picture

    Archives

    January 2023
    November 2022
    June 2022
    May 2022
    May 2021
    May 2020
    April 2020
    March 2020
    September 2019
    December 2018
    April 2018
    March 2018
    January 2018
    December 2017
    September 2017
    June 2017
    April 2017
    March 2017
    February 2017
    January 2017
    December 2016
    November 2016
    October 2016
    August 2016
    July 2016
    June 2016
    May 2016
    April 2016
    March 2016
    February 2016
    January 2016
    December 2015
    November 2015
    October 2015
    September 2015
    August 2015
    July 2015
    June 2015
    May 2015
    April 2015
    February 2015
    January 2015
    December 2014
    November 2014
    October 2014
    September 2014
    August 2014
    July 2014
    June 2014
    May 2014
    April 2014
    March 2014
    February 2014
    September 2013
    May 2013
    April 2013
    March 2013

    RSS Feed

    Categories

    All
    Clean Water
    Climate Change.
    CO2 Levels
    El Nino
    Floods
    Methane
    Ocean Acidity
    Pine Island Galacier
    Sea Level Rise
    Soil Loss
    Storms

    RSS Feed

Proudly powered by Weebly