Climate Outcome NZ
  • Climate Outcome. Home page.
  • Latest posts & news
  • Temperature
  • Precipitation changes in a warming world.
  • Increased flood damage in a warming world.
  • Drought
  • Wind
  • El Nino Southern Ocilation. ENSO.
  • Sea Level
  • Polar melting
  • Arctic sea ice + weather.
  • West Antarctica
  • Ocean Acidity
  • Plant Die Back. Animal Migration.
  • Climate threats
  • Streams a vital resource.
  • Clean energy alternatives.
  • Climate Change in the Bay of Islands
  • The Author. Bob Bingham.
  • Satellite accuracy.
  • Reference sites

Bob Bingham Blog page.

A series of opinion pieces on, mostly climate change and related subjects to do with New Zealand.

Back to home page.

Catastrophic collapse of ice sheets.

30/9/2014

5 Comments

 
We all know that there is so much water locked up in the ice of Greenland and Antarctica that if it melted it will cause serious flooding. In all the large figures of sea level rise it should be remembered that just one metre rise will bring massive economic losses for every country with a shoreline.

 There are two big ice sheet regions, Antarctica and Greenland. Antarctica is split in two with East and West and we can ignore East Antarctica which is so high and cold it is not melting yet.  This leaves West Antarctica which has enough ice to raise sea levels 4.8 meters and Greenland which has enough ice to raise 7.5 meters, they are both completely different and both of them have melted completely in the distant past. 


Picture
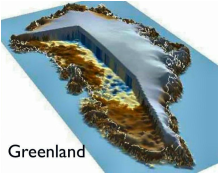
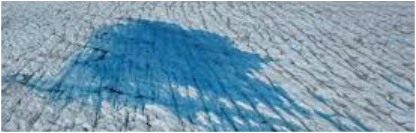
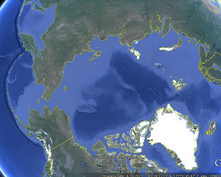
Greenland is a high rocky island which has ice on its surface that is two kilometres thick  and has glacier tails that sit in the sea,  Its vulnerability is that its surface melts in the summer and when it does so the dark blue water absorbs more of the sun’s heat than white ice and this warmer water melts into the ice and eventually makes a hole that will carry a whole lake of warm water into its interior.  

Picture
Picture
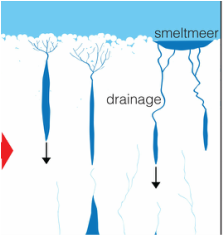
Not much is known about where this warm water goes but the concern here is that the increasing number of holes in the ice and the amount of warm water in the interior are weakening the ice sheets core which will become rotten and vulnerable to catastrophic collapse. There are many elements to Greenland’s ill health, including the amount of soot on the surface that speeds melt and also the increasing speed of glaciers heading to the sea. All in all Greenland is not in good shape.

Picture
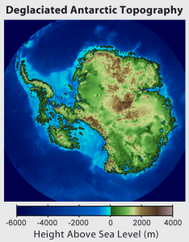
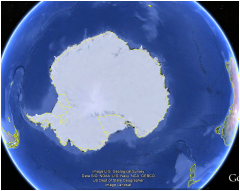
West Antarctica has a different set of problems in that it is a string of islands that are covered in a huge sheet of ice but much of this ice is sitting on the sea bed. The concern here is that the sea water is warming and washing around the bottom of the ice and melting it rapidly. Water has a thermal conductivity that is 24 times greater than air so it has a greater capacity to melt ice quickly and the ocean water is warming.


Picture
Picture
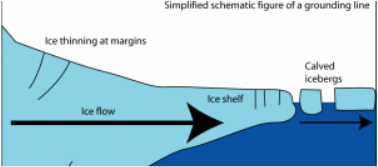
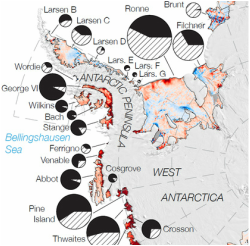
Two East Antarctica ice sheets have broken off and collapsed already but these were floating in the sea and did not add much to sea level rise but they did demonstrate the vulnerability of West Antarctica. The warmer water has been measured at melting 50 mm of ice a day which may not seem much if the ice is 1000 metres thick but it weakens the sheet and then storm waves can break the sheet which then collapses.

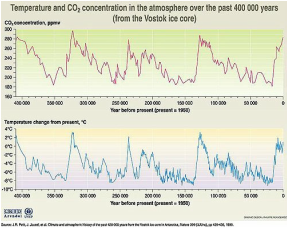
The problem in forecasting a sudden collapse is working out the mechanism of how it happens and then putting a timescale to it.  There are precedents in the recent past when sea level rose at 10 mm a year compared with the current 3.6mm a year.  At 10mm a year or 100 mm every ten years or one meter in 100 years  we could see some serious consequences with inundation of major cities and infrastructure but a sudden ice sheet collapse could bring this foreword in an irregular timescale. 


5 Comments

The Earth’s ‘Wobble’ explained.

28/9/2014

2 Comments

 
There was a piece posted on Climate Denial Crock which showed John Stewart of the Daily Show lampooning the House of Representatives Science, Space and Technology member Steve Stockman (Rep Tex) having trouble with the Earths wobble when questioning the Governments lead climate scientist. Why a politician who has declared that he does not understand science would question a scientist who is top of his field is a mystery but I thought it might be worth a quick explanation of why it is not considered in the models.

Picture
The Earth’s “wobble’ goes from 22.1 degrees when it is nearly upright to a maximum tilt of 24.5 degrees which for simplicity we will call 2.5 Degrees.
This action takes about 125,000 years which is from the depth of an ice age through a warm period and back to an ice age in a repetitive cycle.
This ‘wobble’ happens at the rate of 0.02 degrees every thousand years, or 1 degree every 50,000 years. It is quite a serious movement as during the whole cycle the world would cool 8C, glaciers of ice would be down to Scotland or New York and sea levels would drop 125meters. 

Picture
Climate change forecasting concentrates on the next 100 years with real detail going into the next fifty or even less. With such a vast difference in timescale the climate modellers ignore the tilt action although they are well aware of it's presence.
We should be headed for an ice age but the huge pulse of CO2 we have pumped into the atmosphere has changed our destiny. We have to stop burning fossil fuels which was the real reason the Texas Representative was displaying his ignorance.

Click here for a more detailed explanation.


2 Comments

How cheap is coal as a fuel?

14/9/2014

4 Comments

 
Picture
A few weeks ago we had a steam pipe burst at our local geothermal plant and it took some time to get it fixed because nobody was on duty at the plant.
 Nobody was on duty! The plant is operated from a control centre 30K away 
The geothermal generators were supplying us with electricity and the fact that nobody was there illustrates the low running costs of geothermal compared to coal. 

Picture
Power stations powered by coal are very powerful and a relatively large one running at its normal 50% of rated capacity would be burning about 5000 tons of coal a day. If you take the operating costs over twenty years with the coal mine, railway, engineers servicing boilers and general maintenance costs its an expensive beast to run.

The coal consumption of 5000 tons a day is producing 15,000 tons of CO2 and other pollutants a day and despite 30 years of talking about carbon capture it has not been achieved. The simple reason is that it is far too expensive to achieve and coal is only cheap as long as you vent the pollution to the atmosphere for free.


Picture
Another cost of burning coal is the health of the miners. 
Nobody goes into mining as a lifestyle choice as it is a dirty, dangerous, health destroying occupation and much of the heath costs are taken by the state and paid for out of taxes.

Wind generation, hydro, geothermal and solar all have their energy supplied by nature so that over a few years, when the capital construction cost are covered the cost of the electricity tumbles.
If all the miners were re-employed erecting and installing wind generators and solar panels the miners would have a heathier and more fulfilling life and we would have cheaper electricity.

Picture
CO2 in the atmosphere has climbed from a normal maximum of 280 parts per million to the current 400 ppm. A level we have not seen on this planet for 3.5 million years. In that period there was a completely different environment with temperatures 3C warmer, sea levels 12 metres higher and higher levels of ocean acidity in the oceans. A world in which today's plants and animals were not designed to live.  
We need to stop burning coal urgently and build up out renewable electricity capacity and ultimately convert our transport to electricity.


4 Comments

Why is the Arctic warming and the Antarctic is not?

6/9/2014

0 Comments

 
Picture
The first point to appreciate is that, of all the extra heat absorbed by the planet due to global warming, 93% goes into the oceans 5% goes into melting ice and only 2% goes into warming the atmosphere. This means that the oceans have an overwhelming effect on the surface temperature of the atmosphere.

The next part of the puzzle is the big difference between the Arctic and the Antarctic. The Arctic is an ocean surrounded by land and the Antarctic is a continent of land surrounded by sea. Another difference is that the Arctic is all at sea level and the altitude of the Antarctic land (or ice) is 3000 metres (10,000 feet) and is therefore about 20 centigrade colder due to its height.


Picture
Even allowing for these differences the Arctic is warming faster and this is to do with the geographic layout and the capacity of water to absorb heat.

The Arctic is a closed ocean and does not have strong currents or big storms (these things are all relative). 


Picture
The Antarctic continent by comparison has an uninterrupted flow of strong winds always blowing in the same direction and blowing 365 days a year right round the World. This powerful, constant wind pushes the sea along to form a strong current which is one of the power sources that drive the ocean conveyor, to spread heat around the world and because it is consistent the current reaches into the deepest parts of the ocean where the coldest water lies.

Picture
The Southern Ocean is not consistently deep and has several shallow points. The most noticeable is between South America and West Antarctica but another is between the French Southern Ocean Lands and the Antarctic and another between New Zealand and Antarctica. These shallow areas (again it’s all relative) form turnover points where the cold deep water is driven to the surface where it can mix with the atmosphere and perform a heat exchange. The constant storms in the whole region also constantly churn the surface of this cold water and suck heat from the atmosphere and the combination of all these actions keeps the atmospheric temperature from rising to the levels seen in the Arctic.

Picture
This heat has not gone away it is just being redistributed and will come out later to force atmospheric temperatures up with a speed reminiscent to the period between 1970 and 2000.


0 Comments

Cost of rain intensity.

4/9/2014

5 Comments

 
Picture
In the last eight weeks we have had three rain events of around 200 mm and in two of them there have been bursts when the downfall was in the region of 50 mm an hour. We get quite a bit of rain in the winter but this was bordering on the exceptional.

I am part of an environmental group which is improving the quality of water in the Bay of Islands in order to restore the estuary breeding grounds for fish. Erosion of the banks of rivers and streams blankets the normally fertile estuaries with mud and destroys the eco system in which juvenile fish thrive. Without fish nurseries we will not have fish.
Picture
We had just planted a section of a stream to restore vegetation to the banks so that the roots hold the soil together to resist erosion when we had the first 200 mm event. This washed a lot of our recent planting out of the ground. We assembled another team of volunteers and replanted the stream edge. Then we had the second flood event which was bigger and did more damage than the first. We were running low on plants by this time but we recovered what we could and planted more trees when we had the third event. The last one did not have a rain burst and so it did not flood to the same extent but it certainly made us think. It also confirmed the value of our work as we could see the amount of soil lost in the small section on which we were working.


Picture
On a personal level the gutters on my house, which is thirty years old, were not able to cope with the downpour and overflowed leading to water coming into the house. There are just not enough downpipes to the gutters to drain away rain which falls at the rate of 50 mm an hour. So I am in the process of fitting three new downpipes to cope with future rain events.
Are these events becoming more common. Simple science tells us that for every degree in temperature rise the atmosphere can hold 8% more moisture. New Zealand has had a temperature rise of 0.9 Centigrade and so every rain event has an element of climate change in it.

 As Kevin Trenberth said. "The answer to the oft-asked question of whether an event is caused by climate change is that it is the wrong question. All weather events are affected by climate change because the environment in which they occur is warmer and moister than it used to be”.

I study climate change so I am looking for evidence but am I putting two and two together and making five, am I getting paranoid?


5 Comments

Methane release in East Siberian Arctic sea.

1/9/2014

2 Comments

 
Picture
Methane is a very powerful greenhouse gas and even though in time it will wash out of the atmosphere it is 72 times more powerful than CO2 over twenty years so it needs to be considered.
 Methane hydrates are essentially frozen methane held on the seabed by a combination of low temperatures and deep water pressure. If the water warms, the methane can be released and bubble to the surface and there are vast quantities held there, sufficient to change the climate rapidly, so it is of considerable concern.
Previous scientific analysis has said that the chances of  this happening are remote and up to now there has been little research in the area.


Picture
In an interview between Nazeeth Ahmed of the Guardian and Prof Peter Wadhams, co-author of the Nature study and head of Polar ocean physics at Cambridge University it was explained that there is a completely new situation.
In a shortened version, the East Siberian continental shelf is very shallow and is normally frozen over and very cold and so it has held the methane hydrates safely  on the sea bed.
 The new situation is that the sea ice has melted for long periods in the summer and raised the temperature 7C and this is sufficient to melt the methane and release it to the surface.


Picture
Professor Peter Wadhams is one of the few scientists to work in the field on the Siberian sea and like many scientists who work on the ice he is considerably more concerned than the rest of the scientific community.

Something to watch closely and no doubt there will be more research ships in the region next summer. 


2 Comments

    Bob Bingham 

    Occasional blog posts on topical news items concerning the climate.  Please click the RSS feed to receive updates.

    Picture

    Archives

    January 2023
    November 2022
    June 2022
    May 2022
    May 2021
    May 2020
    April 2020
    March 2020
    September 2019
    December 2018
    April 2018
    March 2018
    January 2018
    December 2017
    September 2017
    June 2017
    April 2017
    March 2017
    February 2017
    January 2017
    December 2016
    November 2016
    October 2016
    August 2016
    July 2016
    June 2016
    May 2016
    April 2016
    March 2016
    February 2016
    January 2016
    December 2015
    November 2015
    October 2015
    September 2015
    August 2015
    July 2015
    June 2015
    May 2015
    April 2015
    February 2015
    January 2015
    December 2014
    November 2014
    October 2014
    September 2014
    August 2014
    July 2014
    June 2014
    May 2014
    April 2014
    March 2014
    February 2014
    September 2013
    May 2013
    April 2013
    March 2013

    RSS Feed

    Categories

    All
    Clean Water
    Climate Change.
    CO2 Levels
    El Nino
    Floods
    Methane
    Ocean Acidity
    Pine Island Galacier
    Sea Level Rise
    Soil Loss
    Storms

    RSS Feed

Proudly powered by Weebly