
The IPCC report on climate change is the gold standard as it is the distilled result of thousands of the top climate scientists in the world. Its weakness is that it can only report what can be definitively proved at the time the report is written and also, the projections of the worst case scenario, RCP 8.5, are so bad that there is not much research to say what the result would be if it actually happened.
There is a quote from Donald Rumsfeld explaining the reasons for invading Iraq without evidence which is more appropriate for the unpredictability of climate change. ‘There are known knowns. These are things we know that we know. There are known unknowns. That is to say, there are things that we know we don't know. But there are also unknown unknowns. There are things we don't know we don't know.’
I also like the quote from Mike Tyson. ’Everyone has a plan until they get punched in the mouth.’
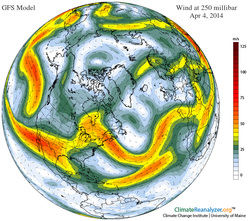
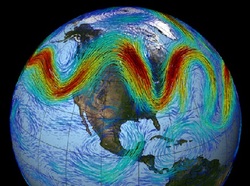
We are making big changes to our planet and even the last ten years have shown us that we are not prepared for the sudden changes that have happened. The Arctic ice was not supposed to melt for many years yet, and the big changes to the jet stream that have caused chaos in the USA, the UK, Germany, Russia and China were not forecast at the start of this century.
Here are two areas that point to an uncertain future but I am sure that they are not the only ones.
There is a quote from Donald Rumsfeld explaining the reasons for invading Iraq without evidence which is more appropriate for the unpredictability of climate change. ‘There are known knowns. These are things we know that we know. There are known unknowns. That is to say, there are things that we know we don't know. But there are also unknown unknowns. There are things we don't know we don't know.’
I also like the quote from Mike Tyson. ’Everyone has a plan until they get punched in the mouth.’
We are making big changes to our planet and even the last ten years have shown us that we are not prepared for the sudden changes that have happened. The Arctic ice was not supposed to melt for many years yet, and the big changes to the jet stream that have caused chaos in the USA, the UK, Germany, Russia and China were not forecast at the start of this century.
Here are two areas that point to an uncertain future but I am sure that they are not the only ones.
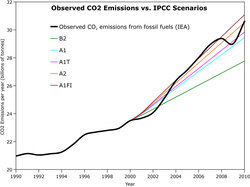
CO2 emissions.
This chart from the International Energy Agency overlays the real CO2 levels over the IPCC forecast scenarios from 2000.
The above chart from the International Energy Agency shows how CO2 emissions have always been at the top end of IPCC projections apart from during times of recession.
The IPCC Fifth report shows an RCP8.5 scenario that probably reflects the reality of the political state of the world. In other words, ‘Business as usual’.
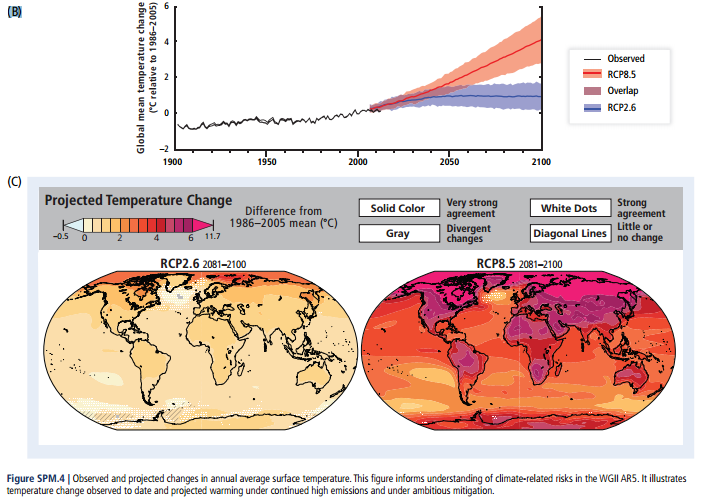
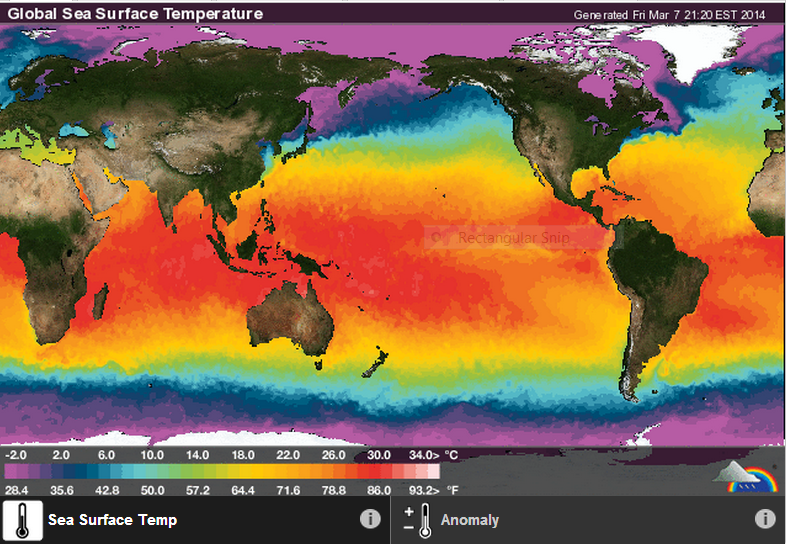
The above chart illustrates the problems. Most productive areas of the world are showing temperature increases of 4C to 6C at which level, food production as we know it cannot take place. The likely result will be substantial food shortages which in turn will precipitate civil unrest and war. Predicting war is impossible so it can be classed as an unpredictable tipping point.
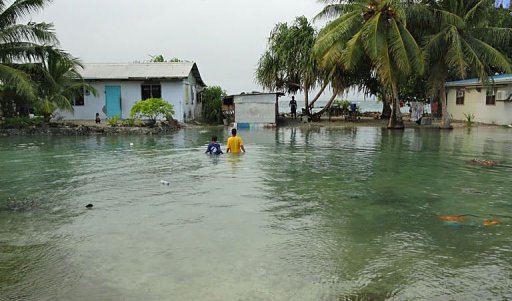
Sea level rise.
Sea level rise has a lot of predictable components such as thermal expansion and the melt rate of ice for given temperatures. What cannot be calculated is the result of catastrophic collapse of an ice shelf or the sudden disintegration of land based glaciers in Greenland or West Antarctica.
This dilemma is illustrated by the Real climate website appraisal of the IPCC Fifth repot. http://www.realclimate.org/index.php/archives/2013/10/sea-level-in-the-5th-ipcc-report/
Here are some extracts which are in turn includes extracts of the IPCC report.
‘The range up to 98 cm is the IPCC’s “likely” range, i.e. the risk of exceeding 98 cm is considered to be 17%, and IPCC adds in the SPM that “several tenths of a meter of sea level rise during the 21st century” could be added to this if a collapse of marine-based sectors of the Antarctic ice sheet is initiated. It is thus clear that a meter is not the upper limit’.
- See more at: http://www.realclimate.org/index.php/archives/2013/10/sea-level-in-the-5th-ipcc-report/#sthash.ADBKTBhu.dpuf
‘In the latest assessment report of the IPCC we did not provide such an upper limit, but we allow the creative reader to construct it. The likely range of sea level rise in 2100 for the highest climate change scenario is 52 to 98 centimetres (20 to 38 inches.). However, the report notes that should sectors of the marine-based ice sheets of Antarctic collapse, sea level could rise by an additional several tenths of a meter during the 21st century. Thus, looking at the upper value of the likely range, you end up with an estimate for the upper limit between 1.2 meters and, say, 1.5 meters. That is the upper limit of global mean sea-level that coastal protection might need for the coming century’
See more at: http://www.realclimate.org/index.php/archives/2013/10/sea-level-in-the-5th-ipcc-report/#sthash.ADBKTBhu.dpuf
The world has experienced meltwater pulses in the past when the conditions have been right.
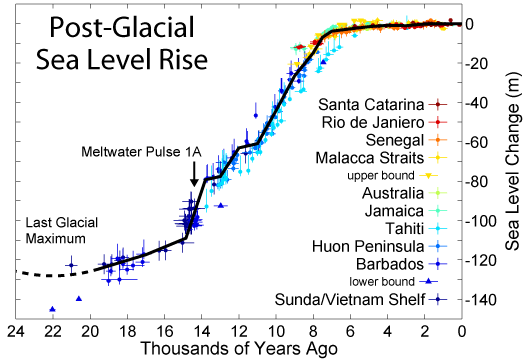
Melt water pulse 1A showed an increase level of twenty meters in four hundred years, or four metres every one hundred years, or one metre every twenty years.
With eleven of the world’s fifteen biggest cities at one metre above sea level plus big areas of productive farmland the economic consequences of sea level rise are incalculable.
‘Everyone has a plan until they get punched in the mouth’
With eleven of the world’s fifteen biggest cities at one metre above sea level plus big areas of productive farmland the economic consequences of sea level rise are incalculable.
‘Everyone has a plan until they get punched in the mouth’

 RSS Feed