Climate Outcome NZ
  • Climate Outcome. Home page.
  • Latest posts & news
  • Temperature
  • Precipitation changes in a warming world.
  • Increased flood damage in a warming world.
  • Drought
  • Wind
  • El Nino Southern Ocilation. ENSO.
  • Sea Level
  • Polar melting
  • Arctic sea ice + weather.
  • West Antarctica
  • Ocean Acidity
  • Plant Die Back. Animal Migration.
  • Climate threats
  • Streams a vital resource.
  • Clean energy alternatives.
  • Climate Change in the Bay of Islands
  • The Author. Bob Bingham.
  • Satellite accuracy.
  • Reference sites

Bob Bingham Blog page.

A series of opinion pieces on, mostly climate change and related subjects to do with New Zealand.

Back to home page.

How big are the areas of uncertainty in the IPCC Fifth report?

19/7/2014

6 Comments

 
The IPCC report on climate change is the gold standard as it is the distilled result of thousands of the top climate scientists in the world. Its weakness is that it can only report what can be definitively proved at the time the report is written and also, the projections of the worst case scenario, RCP 8.5, are so bad that there is not much research to say what the result would be if it actually happened.

There is a quote from Donald Rumsfeld explaining the reasons for invading Iraq without evidence which is more appropriate for the unpredictability of climate change. ‘There are known knowns. These are things we know that we know. There are known unknowns. That is to say, there are things that we know we don't know. But there are also unknown unknowns. There are things we don't know we don't know.’

I also like the quote from Mike Tyson. ’Everyone has a plan until they get punched in the mouth.’

We are making big changes to our planet and even the last ten years have shown us that we are not prepared for the sudden changes that have happened. The Arctic ice was not supposed to melt for many years yet, and the big changes to the jet stream that have caused chaos in the USA, the UK, Germany, Russia and China were not forecast at the start of this century.

Here are two areas that point to an uncertain future but I am sure that they are not the only ones.
Picture
CO2 emissions.

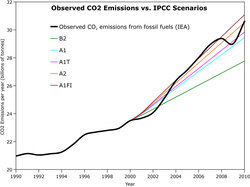
This chart from the International Energy Agency overlays the real CO2 levels over the IPCC forecast scenarios from 2000.


The above chart from the International Energy Agency shows how CO2 emissions have always been at the top end of IPCC projections apart from during times of recession.

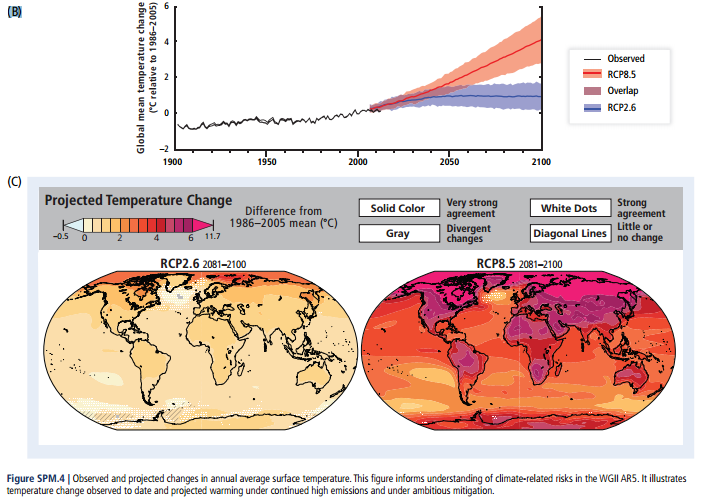
The IPCC Fifth report shows an RCP8.5  scenario that probably reflects the reality of the political state of the world. In other words, ‘Business as usual’.


Picture
The above chart illustrates the problems. Most productive areas of the world are showing temperature increases of 4C to 6C at which level, food production as we know it cannot take place. The likely result will be substantial food shortages which in turn will precipitate civil unrest and war. Predicting war is impossible so it can be classed as an unpredictable tipping point.

Sea level rise.

Sea level rise has a lot of predictable components such as thermal expansion and the melt rate of ice for given temperatures. What cannot be calculated is the result of catastrophic collapse of an ice shelf or the sudden disintegration of land based glaciers in Greenland or West Antarctica.

This dilemma is illustrated by the Real climate website appraisal of the IPCC Fifth repot.
http://www.realclimate.org/index.php/archives/2013/10/sea-level-in-the-5th-ipcc-report/

Here are some extracts which are in turn includes extracts of the IPCC report.

‘The range up to 98 cm is the IPCC’s “likely” range, i.e. the risk of exceeding 98 cm is considered to be 17%, and IPCC adds in the SPM that “several tenths of a meter of sea level rise during the 21st century” could be added to this if a collapse of marine-based sectors of the Antarctic ice sheet is initiated. It is thus clear that a meter is not the upper limit’.


- See more at: http://www.realclimate.org/index.php/archives/2013/10/sea-level-in-the-5th-ipcc-report/#sthash.ADBKTBhu.dpuf

‘In the latest assessment report of the IPCC we did not provide such an upper limit, but we allow the creative reader to construct it. The likely range of sea level rise in 2100 for the highest climate change scenario is 52 to 98 centimetres (20 to 38 inches.). However, the report notes that should sectors of the marine-based ice sheets of Antarctic collapse, sea level could rise by an additional several tenths of a meter during the 21st century. Thus, looking at the upper value of the likely range, you end up with an estimate for the upper limit between 1.2 meters and, say, 1.5 meters. That is the upper limit of global mean sea-level that coastal protection might need for the coming century’

 See more at: http://www.realclimate.org/index.php/archives/2013/10/sea-level-in-the-5th-ipcc-report/#sthash.ADBKTBhu.dpuf

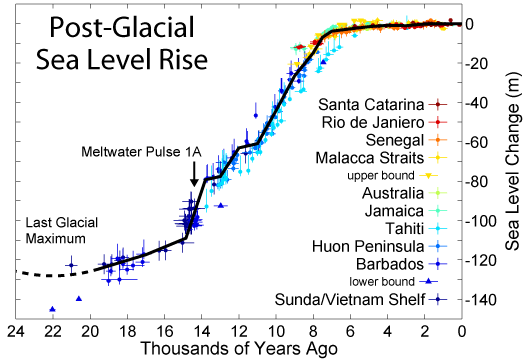
The world has experienced meltwater pulses in the past when the conditions have been right.


Picture
Melt water pulse 1A showed an increase level of twenty meters in four hundred years, or four metres every one hundred years, or one metre every twenty years.

With eleven of the world’s fifteen biggest cities at one metre above sea level plus big areas of productive farmland the economic consequences of sea level rise are incalculable.  


‘Everyone has a plan until they get punched in the mouth’


6 Comments
Adrian Vance link
20/7/2014 12:02:39 am

Earth is an 8,000 mile globe with a surface area of 210 million square miles. 71% of it is covered by water with an average depth of 16,000 feet or 3.03 miles, thus includes 451 million cubic miles of sea water. Every foot of depth is equal to 28,000 cubic miles of seawater.

Arctic ocean ice floats and is accounted for like ice cubes in a glass of water. Melting it makes no difference in the sea level. According to The Journal of Geophysical Research, JGR, all the glaciers and Antarctica include 41,000 cubic miles of ice which melt forming 36,900 cubic miles of water. This would increase the water level on Earth 1.32 feet or 16 inches and not the 260 feet claimed by the USGS bureau.

The published JGR analysis is never reported in mainstream media. People who want to scare you say the seas will rise 260 ft. They want new taxes, your money and more power by scaring you. It is just that simple.

For science and political matters explained to you in language you can understand come to "Two Minute Conservative," with Google and when you speak they will listen.

Reply
Bob Bingham
20/7/2014 03:17:03 am

It no wonder the USA is in such economic decline trying to use the old imperial dimensions. The rest of the world is metric and have no trouble working out sea levels. Every 100 gigatonnes of melting land ice increases the sea level by 0.23 mm. Our New Zealand scientists in conjunction with the rest of the world know that sea levels 120 metres since the last ice age. and is going up 3.26 mm a year.

Reply
Adrian Vance link
20/7/2014 12:04:12 am

CO2 is a “trace gas” in air, insignificant by definition. It absorbs 1/7th as much IR, heat energy, from sunlight as water vapor which has 188 times as many molecules capturing 1200 times as much heat making 99.9% of all "global warming." CO2 does only 0.1% of it. For this we should destroy our economy?

The Medieval Warming from 800 AD to 1300 AD that Micheal Mann erased to make his "hockey stick" was several degrees warmer than anything "global warmers" fear. It was the longest recorded time, 500 years, of peace with great abundance for all.

The Vostock Ice Core data analysis show CO2 increases follow temperature increases by 800 years 19 times in 450,000 years. That makes temperature change cause and CO2 change effect; not the other way around. This alone refutes the anthropogenic global warming concept.

Carbon combustion generates 80% of our energy. Control and taxing of carbon would give the elected ruling class more power and money than anything since the Magna Carta of 1215 AD.

Most scientists and science educators work for tax supported institutions eager to help government raise more money for them. And, they love being seen as "saving the planet."

Google "Two Minute Conservative," and you will be applauded when you speak truth at your next dinner party, barbecue or church picnic.

Reply
Robert Bristow
9/8/2014 04:34:36 pm

We have moved on since the attempt to discredit Mann by the disgraceful and criminal theft of e-mails, other totally independent groups have confirmed the "Hockey Stick" is a true and scientifically correct produced graph. The Medieval warming period was highly regional occurrence that happened in a time of exceptionally high solar activity and low volcanic activity that is not happening today. The global temperature anomaly average was less than today and the warming properties of green house gases are well proven in science. You and your imperial measurements are in decline, as science is becoming accepted at this late and urgent phase of our disruptive development on this planet.

Reply
Bob Bingham
20/7/2014 03:33:50 am

Once again Adrian you are hopelessly adrift. I don't know what they teach in American schools but Svante Arrhenius worked out in 1906 that CO2 is a greenhouse gas and could warm the planet. He did this long before the temperature had started to rise.

Reply
tom
16/10/2019 05:17:37 pm

I would like advice

Reply


Leave a Reply.

    Bob Bingham 

    Occasional blog posts on topical news items concerning the climate.  Please click the RSS feed to receive updates.

    Picture

    Archives

    January 2023
    November 2022
    June 2022
    May 2022
    May 2021
    May 2020
    April 2020
    March 2020
    September 2019
    December 2018
    April 2018
    March 2018
    January 2018
    December 2017
    September 2017
    June 2017
    April 2017
    March 2017
    February 2017
    January 2017
    December 2016
    November 2016
    October 2016
    August 2016
    July 2016
    June 2016
    May 2016
    April 2016
    March 2016
    February 2016
    January 2016
    December 2015
    November 2015
    October 2015
    September 2015
    August 2015
    July 2015
    June 2015
    May 2015
    April 2015
    February 2015
    January 2015
    December 2014
    November 2014
    October 2014
    September 2014
    August 2014
    July 2014
    June 2014
    May 2014
    April 2014
    March 2014
    February 2014
    September 2013
    May 2013
    April 2013
    March 2013

    RSS Feed

    Categories

    All
    Clean Water
    Climate Change.
    CO2 Levels
    El Nino
    Floods
    Methane
    Ocean Acidity
    Pine Island Galacier
    Sea Level Rise
    Soil Loss
    Storms

    RSS Feed

Proudly powered by Weebly