Climate Outcome NZ
  • Climate Outcome. Home page.
  • Latest posts & news
  • Temperature
  • Precipitation changes in a warming world.
  • Increased flood damage in a warming world.
  • Drought
  • Wind
  • El Nino Southern Ocilation. ENSO.
  • Sea Level
  • Polar melting
  • Arctic sea ice + weather.
  • West Antarctica
  • Ocean Acidity
  • Plant Die Back. Animal Migration.
  • Climate threats
  • Streams a vital resource.
  • Clean energy alternatives.
  • Climate Change in the Bay of Islands
  • The Author. Bob Bingham.
  • Satellite accuracy.
  • Reference sites

Bob Bingham Blog page.

A series of opinion pieces on, mostly climate change and related subjects to do with New Zealand.

Back to home page.

IPCC Scenario’s Explained

26/2/2016

1 Comment

 
Picture
When the IPCC make a forecast about future temperatures or sea level rise there is always a very large range of uncertainty, which makes it all look as though the science was not very clear or settled, but this is not the case at all.
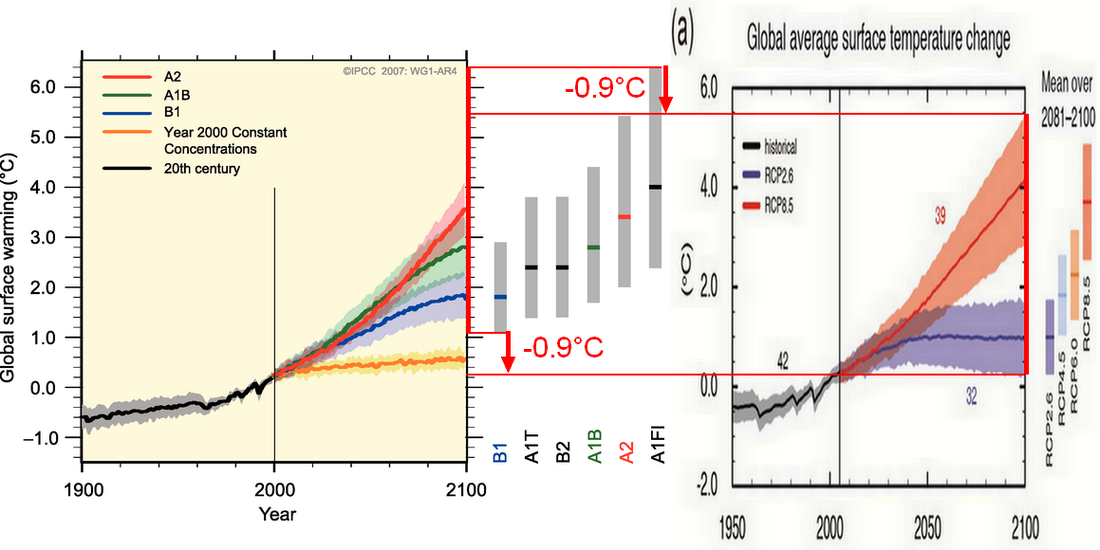
The problem is that climate scientists do not know what we, the human race, are going to do with regard to our greenhouse gas emissions. To get a range of options the climate scientists went to sociologists and asked them to work out what was possible and what might happen and the result was a series of four pathways that we might follow.
The chart above, on the right, shows the two extreme options in dark blue (RCP2.6) and dark red (RCP8.5) and the two intermediate are shown in the far right column in light blue (RCP4.5) and light red (RCP6.0).
The RCP2.6 etc. are the Representative Concentration Pathway and the numbers refer to the Watts per square meter of climate forcing. The numbers themselves are not a lot of help but the scenario enables us to understand where we are going. 

We are currently tracking above the worst case scenario, but let us look at what we need to do to meet the best scenario of RCP2.6.  We would need to stop producing CO2 by ceasing to burn coal and oil almost immediately and improve our farming techniques by reducing our cattle herd by three quarters, eliminate waste so that we ate everything that we grew, and this might cut our farming by one third. We would have to actively try to remove CO2 from the atmosphere by planting vast forests on land that we have cleared, and we might try industrial sized effort to remove CO2 from the atmosphere.
You can stop smiling because that is clearly not going to happen and that means that you can remove the bottom part of any range of options.
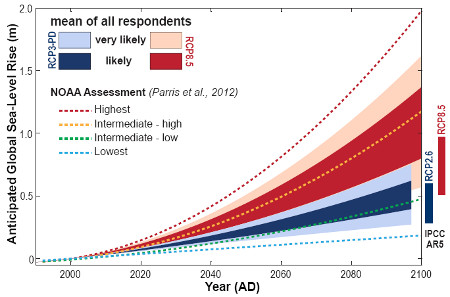
The next option is RCP4.5 which is what most people would consider an extreme change to our lifestyle, achievable but highly unlikely and I think we can safely remove the second level of uncertainty. This leaves us with the more realistic RCP6.0 and RCP8.5 which makes it a lot easier to read the graphs and here is one from NOAA on sea level rise using the IPCC criteria.
Picture
The graphs are now much easier to read because you can eliminate the blue parts of the graph and look at the red and yellow dotted lines. Even here there is uncertainty but this time it is a scientific one and it involves the sudden collapse on an ice shelf. This would be a massive event and not enough is known about the ice shelves to make a forecast so it was deliberately excluded.
There will almost certainly be a sudden collapse of one or more ice shelves before the end of the century so your guess as to the timing and the result is as good as anyone else.

Ocean Acidity.
Picture
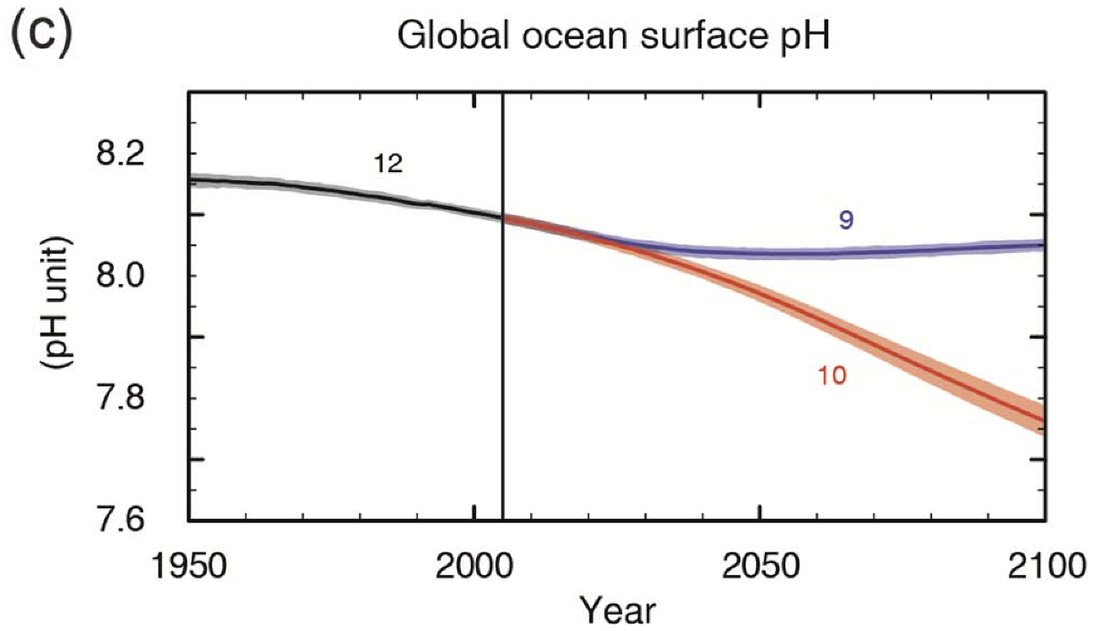
Another awkward chart to read is the ocean acidity where, counter intuitively, as the acidity of the ocean increases the pH number gets smaller. In this case we start out today with a pH number of 8.2 and by the end of the century it could be 7.7 which is widely believed to be beyond the reproductive capability of phytoplankton, shell fish and coral.
1 Comment
jacknmeovslo
24/3/2016 09:30:20 am

What happens if I continue to increase the size of my tire fires on a daily basis ... lets say from today until the day you die?

Reply


Leave a Reply.

    Bob Bingham 

    Occasional blog posts on topical news items concerning the climate.  Please click the RSS feed to receive updates.

    Picture

    Archives

    January 2023
    November 2022
    June 2022
    May 2022
    May 2021
    May 2020
    April 2020
    March 2020
    September 2019
    December 2018
    April 2018
    March 2018
    January 2018
    December 2017
    September 2017
    June 2017
    April 2017
    March 2017
    February 2017
    January 2017
    December 2016
    November 2016
    October 2016
    August 2016
    July 2016
    June 2016
    May 2016
    April 2016
    March 2016
    February 2016
    January 2016
    December 2015
    November 2015
    October 2015
    September 2015
    August 2015
    July 2015
    June 2015
    May 2015
    April 2015
    February 2015
    January 2015
    December 2014
    November 2014
    October 2014
    September 2014
    August 2014
    July 2014
    June 2014
    May 2014
    April 2014
    March 2014
    February 2014
    September 2013
    May 2013
    April 2013
    March 2013

    RSS Feed

    Categories

    All
    Clean Water
    Climate Change.
    CO2 Levels
    El Nino
    Floods
    Methane
    Ocean Acidity
    Pine Island Galacier
    Sea Level Rise
    Soil Loss
    Storms

    RSS Feed

Proudly powered by Weebly