
Putting the atmosphere and CO2 into simple terms.
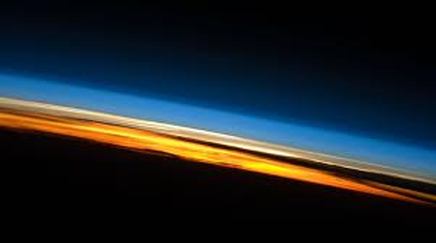
This is a picture of the atmosphere taken from space and the Troposphere, which is the part we live in, is the light blue section. The Troposphere is roughly ten thousand metres thick and at the top of it the temperature, where passenger jets fly, is about -54C. Not a place where we humans can live.
This is a picture of the atmosphere taken from space and the Troposphere, which is the part we live in, is the light blue section. The Troposphere is roughly ten thousand metres thick and at the top of it the temperature, where passenger jets fly, is about -54C. Not a place where we humans can live.
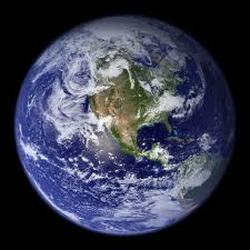
The earth is 12,500 kilometres in diameter and if we convert the scale of the earth and its atmosphere to millimetres and knock of all the noughts, to reduce the scale to a manageable size, the earth would be 1250 millimetres and the atmosphere 1 millimetre.
For those not familiar with the metric system 1,250 mm is roughly from the tip of an outstretched left arm to the elbow of the right arm and 1 mm is the thickness of your finger nail.
So far as the atmosphere is concerned, there is not much of it.
For those not familiar with the metric system 1,250 mm is roughly from the tip of an outstretched left arm to the elbow of the right arm and 1 mm is the thickness of your finger nail.
So far as the atmosphere is concerned, there is not much of it.
| To illustrate our habitable region a bit further. | 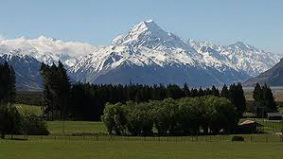
|
The tree line in the mid latitudes is at about 2000 metres and the temperature there is 0C and above that nothing much grows. We humans and most of the creatures and plants live in the warmer region below 1000 metres. Out of a very skinny troposphere we live in the bottom 10%.

Greenhouse gasses.
Greenhouse gasses warm the earth and it’s just as well they do because the world would be 35C colder than it is today. Water vapour is the biggest greenhouse gas and makes up 2% of the atmosphere and CO2 makes up only 0.04% at 280 parts per million. The problem for us is that CO2 is the main driver of change and we are producing a lot of it by burning fossil fuels.
According to the International Energy Agency http://www.iea.org/ in 2012 we put 32,578,641,000 tons of CO2 into our skinny atmosphere by burning fossil fuels alone. This started in about 1750 with the burning of coal but the big numbers started after World War 2, in about 1950, and the amount has increased steadily and continues to grow at 2 points a year.
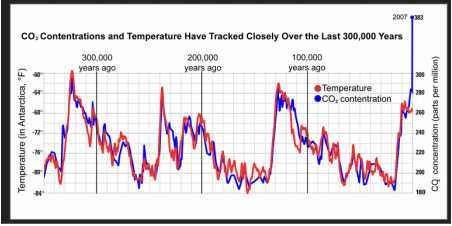
The chart above illustrates the growth of CO2 from its normal range of 180 ppm to 280 ppm to the current figure of 400 ppm.
The problem for our civilisation, as we know it, is that the world has not had 400 ppm of CO2 in the atmosphere for 3.5 million years and the plants and animals alive today are not equipped to live in the temperatures associated with this new level.
We are committed to a sea level rise of 12 metres and a temperature increase of 3C and this is not a good scenario for us with seven billion people on the planet.
To understand how the natural ice ages and warm periods happen. http://globalwarmingsimplified.weebly.com/
The threats to our way of life. http://www.climateoutcome.kiwi.nz/climate-threats.html

 RSS Feed