Climate Outcome NZ
  • Climate Outcome. Home page.
  • Latest posts & news
  • Temperature
  • Precipitation changes in a warming world.
  • Increased flood damage in a warming world.
  • Drought
  • Wind
  • El Nino Southern Ocilation. ENSO.
  • Sea Level
  • Polar melting
  • Arctic sea ice + weather.
  • West Antarctica
  • Ocean Acidity
  • Plant Die Back. Animal Migration.
  • Climate threats
  • Streams a vital resource.
  • Clean energy alternatives.
  • Climate Change in the Bay of Islands
  • The Author. Bob Bingham.
  • Satellite accuracy.
  • Reference sites

Bob Bingham Blog page.

A series of opinion pieces on, mostly climate change and related subjects to do with New Zealand.

Back to home page.

Planet Earth should be renamed Oceania.

25/7/2015

2 Comments

 
Picture
We humans live on the land and have named our planet Earth but as we get to learn more about our home it becomes obvious that the greatest habitable part is in the ocean.

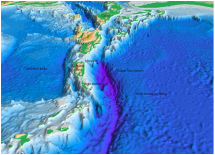
Water in the oceans dictates almost all life and climate on our planet and we only have a very sketchy idea of its make-up. A few obvious things we know are that 70% of the Earth’s surface is ocean,  93% of all the heat from the Sun goes into oceans, it's deepest point is 11,000 metres deep compared to the highest point on land, Everest at 8884 metres. 


Picture
The oceans have an average depth of 4.2 kilometres compared to the troposphere of 10 kilometres but we only live in the bottom one kilometre of the atmosphere. In addition water is thicker and heavier than air and is 784 times denser so it could be argued that water has a much greater capacity than air.

As far as life is concerned 93% of all biomass is in the oceans and we get 50% of all the oxygen we need to breathe from the oceans.  Most life is in the top 100 metres of the sea, where sunlight penetrates, but the dark deeps hold more life than we expected and we know almost nothing about them.


Picture
Of all the water on the planet 95.6% is in the oceans  and only 2.5% is fresh water. Of the available fresh water 68.7% is locked up in ice, 30.1% is in ground water (aquifers) and 1.2% is surface water available for our use. 
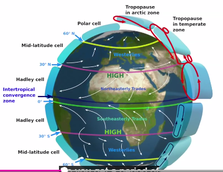
There is a minuscule, but very important amount of water in the atmosphere. This is important because the water vapour condenses and makes rain and it is a vital contribution to changing temperature, redistributing heat and of course it is a big factor in our weather. Water vapour is an important greenhouse gas but it is driven by other factors such as temperature as water vapour increases in the atmosphere by 8% for every 1c increase in temperature.

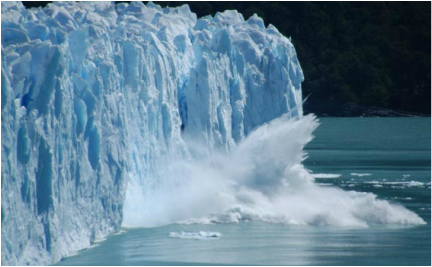
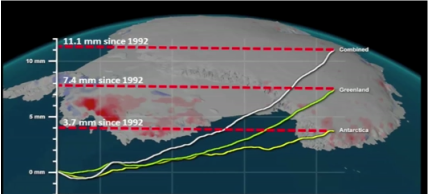
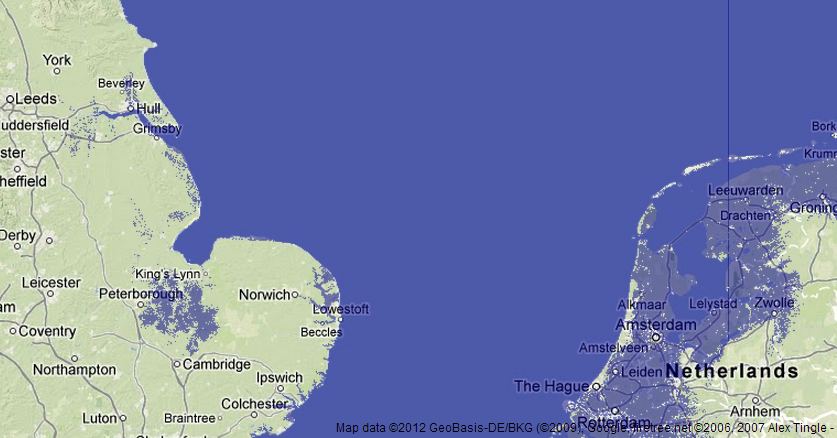
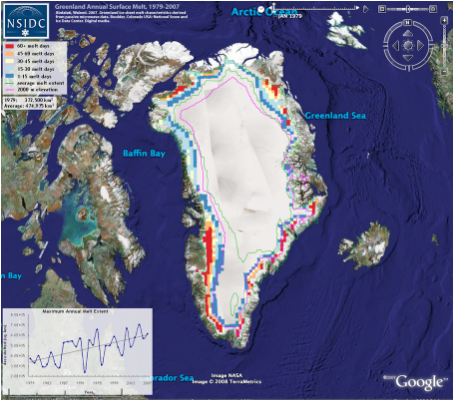
There is enough water locked up in ice to increase the sea level by 66 metres and, as many of us live near the sea, we only need a one metre sea level rise to flood so much infrastructure that it will bankrupt most economies. When the planet was in the last ice age period the sea levels were 120 metres lower so there is quite a lot of natural movement.

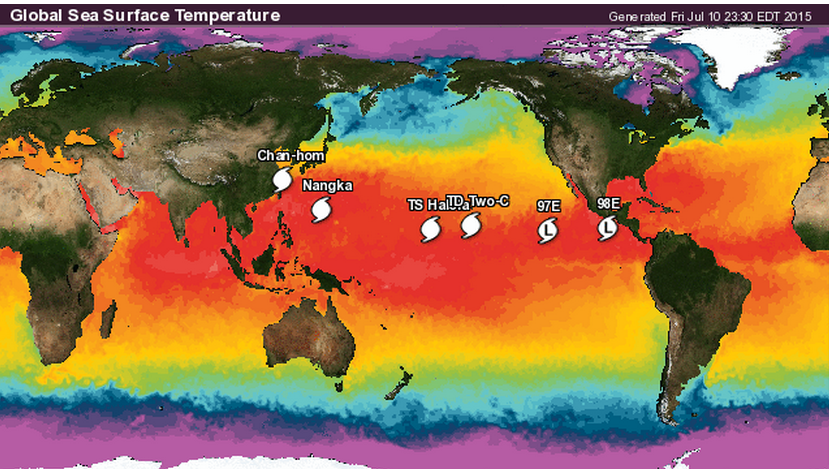
There are important aspects of climate change that are dominated by the oceans. 93% of all the heat from the sun is absorbed by the oceans, 3% goes into melting ice and 3% is absorbed by the earth. Only 1% is taken up by the atmosphere. There is as much heat in the top three metres of the oceans as there is in the whole atmosphere.

Picture
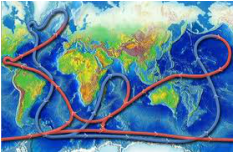
The oceans contain the thermhohaline circulation currents that are vital to distributing heat around the planet and of course the interaction between the oceans and the atmosphere with clouds and storms that make our weather.

Picture
Probably the most important aspect of climate change and the way we are changing the planet is that the oceans are absorbing 25% of the CO2 that is produced by humans, which reduces the greenhouse effect, but it is making the oceans more acidic. Sea water is a saline solution with a pH number of 8.25 and has moved to a more acidic level of 8.14. Although this may not seem much it is a 30% increase in acidity. Marine life is very sensitive to acidity, especially creatures with a calcium carbonate structure such as plankton, the base of the food chain. Information on plankton is sketchy but there is a reported 40% decline in their numbers and their wellbeing is vital to our lives on this planet.

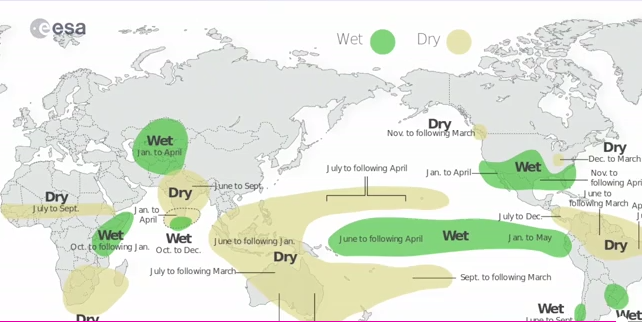
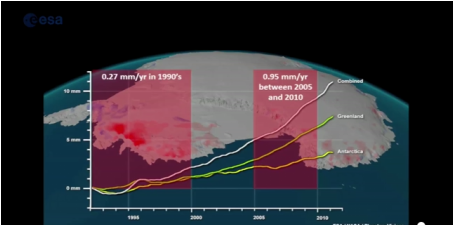
We can understand floods and drought on the land but the big action is in the oceans and it will pay to be alert to ocean acidity and ice sheet loss as they will have devastating effects. 

2 Comments

Typhoons in the Pacific

14/7/2015

0 Comments

 
Picture
It missed. Fortunately for the Chinese and for us the typhoon moved quickly by, just offshore, but it does highlight the dangers of building a massive city at sea level.
The extra warm water in the Pacific caused by the El Nino on top of global warming has spawned a whole string of powerful typhoons that are heading for the Philippines and China. Wundermaps.


Picture
The track of Chan-hom goes very close to Shanghai which is only one metre above sea level and is an industrial complex with a population of 24 million.
The storm is then plotted to cross North Korea whose people are desperately poor and already suffering with a tyrannical government.
There may not be much activity in the Atlantic but the Pacific is in turmoil and very dangerous.

0 Comments

What will the world be like in 2020/25?

11/7/2015

1 Comment

 
Picture
A lot of things are changing in the world due to technology and climate forces. Three areas to watch are internet digital technology, energy sources and world opinion about climate change.

Technology.

A very high proportion of us now have smart phones which are just small but powerful computers we carry with us and we get our news, communication and entertainment from them. The big change here is that all the old media moguls are struggling to stay in the game or going broke. Most importantly they are losing influence and we have other people giving us information so there is les control than there used to be.  Entertainment and communication are shifting fast and where it goes next is still being played out.

Energy.
Despite the huge increases in new electrical appliances we are using less electricity and to make the problem situation worse it is much cheaper to make your own energy by installing solar panels. To compound the energy problem we passed peak oil in 2007 and have only had cheap oil by an oversupply of fracking oil which is in itself expensive ‘tight’ oil and gas and is not going to last long. Electric cars are still rare but the technology is proven and the cars are in production and it only took ten years for a sea change in attitude between the horse and cars, busses and trains. The First World War was started on horses and finished with tanks.  Electric transport is gaining ground and public opinion swinging in its favour so the sentiment is right for a sudden swing should the price of oil surge upwards. Can anyone venture a guess for the price of oil in five years’ time?.


Climate change.

There is a massive amount of research going into climate change and all the results are consistently bad and the information about this is slowly filtering into the mainstream media. The biggest polluter is coal and the price has plummeted and so has the share values of the companies which make it difficult for them to exert influence. This situation can only get worse as renewables provide a cheaper source of electrical energy. Even the big polluting countries such as the USA, Canada, Australia and China are finding that they are struggling to find support for their oil and coal industries.

If we have a few big droughts that force up the price of food, as has happened in the Middle East, we would get more civil revolts and this can crystallise and focus world opinion into cause and effect.

I am not going to make any predictions as the readers opinion is as good as mine but it is something we should all be thinking about and factoring into life’s decisions.


1 Comment

Melting ice and sea levels.

6/7/2015

0 Comments

 
Picture
We hear about Greenland and Antarctica losing XX gigatonnes of ice a year but how big is a gigatonne and what does this do to sea levels?

A gigatonne is a billion tonnes (1,000,000,000 ) and in volume it consists of one billion cubic metres of water. Its actually a cube with one kilometre sides ( 1000 metres x1000 x 1000 )

Even this large measurement is tiny compared to sea level rise and so a handy measurement is 100 gigatonnes  will raise the sea level 0.27 millimetres . For Americans this would be a block 5/8 mile wide and 5/8 mile high and 62.5 miles long and your fingernail is about one millimetre thick so you would need four times 0.27 mm to make the millimetre.
Picture
Sea level is increased by a number of different sources including thermal expansion, melting glaciers, and pumping aquifer wells. Up to now thermal expansion has been the largest contributor but it has just been overtaken by melting glaciers and here the major increase has been from Greenland with Antarctica a close second.


Picture
 Melt rates vary from year to year in any location so the most reliable measurements come from satellites using both the NASA GRACE and the European Space Agency CryoSat and it is estimated that Antarctica now losing 310 gigatonnes a year and Greenland now about 370 gig tonnes a year. Put together these two make 680 gigatonnes and at 0.27 a gigatonne makes 1.8 mm a year and NASA say sea level is rising at the rate of 3.2 mm a year.

The worry is that both regions are accelerating and we only need one metre to bankrupt most economies.


Picture
Using the UK as an example you can see how sea water has inundated the land right around Peterborough with massive loss of farmland and infrastructure plus of corse the devastation if Holland. 


0 Comments

El Nino is officially here

5/7/2015

0 Comments

 
After a lot of stop starts over the last year NOAA have now made this statement.
El Niño conditions are present.* Positive equatorial sea surface temperature (SST) anomalies continue across most of the Pacific Ocean. There is a greater than 90% chance that El Niño will continue through Northern Hemisphere fall 2015, and around an 85% chance it will last through the 2015-16 winter.*
Where ever you live on the planet you will be affected by this event and probably a lot of people will die or suffer hardship.
Picture
0 Comments

Greenland melting

5/7/2015

0 Comments

 
Picture
We now have thirty years of satellite records monitoring Greenland and they reveal a steady increase in the melt rate.

Picture
During the 90's Greenland was contributing 0.27 mm a year to sea levels but in five years from 2000 the rate is now 0.95 mm and is still accelerating. It has now added 11.5 mm to overall rise in sea levels

Greenland is very high and so the top is not melting but higher levels are being affected each decade. The big acceleration is at sea level and in particular where warmer sea water is melting the glaciers from below. There is also the problem of dark snow where soot from forest fires and jet planes is settling on the snow and increasing the melt rate.
Greenland is at lower latitudes and suffers by being adversely affected by civilisation and climate change and it has the potential to add seven metres to sea levels and we only need one metre for economic collapse of many of the richest developed nations.
 
0 Comments

    Bob Bingham 

    Occasional blog posts on topical news items concerning the climate.  Please click the RSS feed to receive updates.

    Picture

    Archives

    January 2023
    November 2022
    June 2022
    May 2022
    May 2021
    May 2020
    April 2020
    March 2020
    September 2019
    December 2018
    April 2018
    March 2018
    January 2018
    December 2017
    September 2017
    June 2017
    April 2017
    March 2017
    February 2017
    January 2017
    December 2016
    November 2016
    October 2016
    August 2016
    July 2016
    June 2016
    May 2016
    April 2016
    March 2016
    February 2016
    January 2016
    December 2015
    November 2015
    October 2015
    September 2015
    August 2015
    July 2015
    June 2015
    May 2015
    April 2015
    February 2015
    January 2015
    December 2014
    November 2014
    October 2014
    September 2014
    August 2014
    July 2014
    June 2014
    May 2014
    April 2014
    March 2014
    February 2014
    September 2013
    May 2013
    April 2013
    March 2013

    RSS Feed

    Categories

    All
    Clean Water
    Climate Change.
    CO2 Levels
    El Nino
    Floods
    Methane
    Ocean Acidity
    Pine Island Galacier
    Sea Level Rise
    Soil Loss
    Storms

    RSS Feed

Proudly powered by Weebly