Climate Outcome NZ
  • Climate Outcome. Home page.
  • Latest posts & news
  • Temperature
  • Precipitation changes in a warming world.
  • Increased flood damage in a warming world.
  • Drought
  • Wind
  • El Nino Southern Ocilation. ENSO.
  • Sea Level
  • Polar melting
  • Arctic sea ice + weather.
  • West Antarctica
  • Ocean Acidity
  • Plant Die Back. Animal Migration.
  • Climate threats
  • Streams a vital resource.
  • Clean energy alternatives.
  • Climate Change in the Bay of Islands
  • The Author. Bob Bingham.
  • Satellite accuracy.
  • Reference sites

Bob Bingham Blog page.

A series of opinion pieces on, mostly climate change and related subjects to do with New Zealand.

Back to home page.

Climate change 40 year lag.

30/3/2014

1 Comment

 
The IPCC will be releasing their second report this week and no doubt the news will be reporting on it. The IPCC are normally very cautious and only say what they can prove but the second report gives them some flexibility on forecasting the future and we may get a report closer to reality.

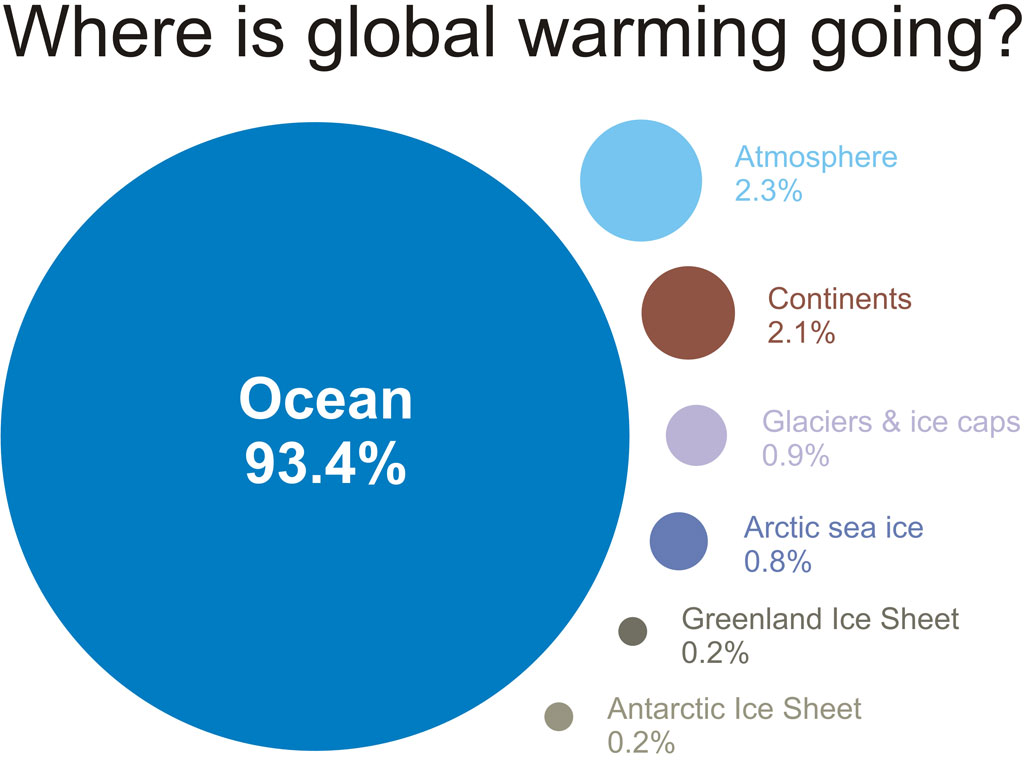
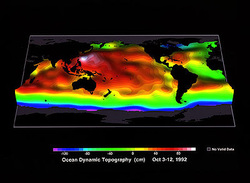
CO2 from the burning of fossil fuels has been rising at a steady level and now stands at 400 part per million, a level we have not seen for about three million years. However we do not have the weather and sea levels to go with 400 ppm as there is a long delay while the oceans, which absorb 90% of the new heat, take in the heat and let it out later.

This delay is estimated to be 40 years and so we are only having the weather in relation to the CO2 of 1970.


Picture
We are adding CO2 to the atmosphere at the rate of 3 points per year with no sign of getting it under control and as you can see from the NASA graph from Sceptical Science we have a long way to go yet. This approximate delay only applies to the surface temperature while rising sea levels take longer to react.
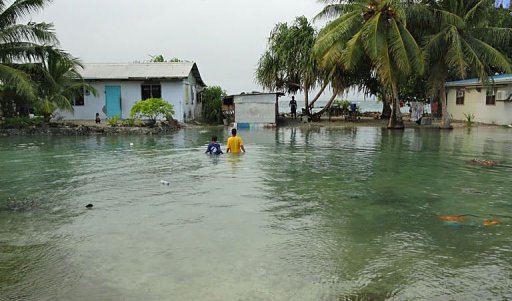
 The last time the world had 400 ppm of sea level rise the sea level was 12 meters higher than today so that also has a long way to go.http://www.climateoutcome.kiwi.nz/

1 Comment

First El Nino since records began.

18/3/2014

1 Comment

 
Although we have been measuring temperature, sunshine hours and rainfall for 160 years ,since the thermometer was invented, we have almost no records of the oceans. The oceans make up 70% of the Earth surface and they absorb 93% of all the heat retained on earth.
Picture
By comparison with the records we keep on land we know very little about what goes on under the surface of the oceans.
The Argo project was devised to launch 3500 floats to cover the oceans and record temperatures,salinity and velocity down to a depth of 2000 meters.

 
This is text taken from the Argo web site.
‘Lack of sustained observations of the atmosphere, oceans and land have hindered the development and validation of climate models. An example comes from a recent analysis which concluded that the currents transporting heat northwards in the Atlantic and influencing western
European climate had weakened by 30% in the past decade. This result had to be based on just five research measurements spread over 40 years. Was this change part of a trend that might lead to a major change in the Atlantic circulation, or due to natural variability that will reverse in the future, or is it an artifact of the limited observations?

In 1999, to combat this lack of data, an innovative step was taken by scientists to greatly improve the collection of observations inside the ocean through increased sampling of old and new quantities and increased coverage in terms of time and area.’

. 
Picture
There are now 3500 floats around the World and they have been operational since 2007. Seven years is not long to monitor a changing climate and even then it is an incomplete set of records. Due to the difficulty of  maintaining devices in the part of the sea where there is no sunlight  and there is extreme pressure, there are almost no measurements taken of the very deep parts of the oceans .

The last El Nino was in 1998 which saw a massive spike in atmospheric temperatures with droughts and floods and huge disruption to farming and food production but there are very few records from the Pacific which was the main driver of the event.

NASA has now raised the likelihood of an El Nino in September to 50%  and no doubt there will be a big scramble to get buoys, satellites and other measuring devices in position to record the event for the first time..  

1 Comment

Impending EL Nino warning and flooded Marshall Islands.

10/3/2014

4 Comments

 
NASA has observed an increase in the strength of the trade winds in the Pacific at the equator which is often a precursor to an El Nino event and they have raised the likelihood of it happening to 50%.  El Nino events bring a flood of warm water across the Pacific from the Philippines area towards the Americas and this upsets the weather pattern over half of the globe bringing floods to some areas and drought to others.

In a more stable La Nina situation trade winds blow from the Ecuador region of America out across the Pacific pulling up cool nutrient rich water from the deep and creating ideal fishing conditions.

This can be clearly seen in the Weather Undergound temperature chart with a cool (yellow) area close to the South American coast.


Picture
The cool water spills out across the Pacific, warming as it goes.

Picture
Sea levels are not even around the World, like in a bath, but can pile up due to winds or thermal expansion from increased heat. This illustration  is from a different period but shows what it would look like.


Picture
The NASA Jason2 satellite shows that the strong trade winds are piling up warm water in the Western Pacific.With the extra strong trade winds blowing, the warm water builds up and heats and this will continue for some months until the trade winds fade and the warm water spills back across the Pacific in a classic El Nino situation.


Picture
This chart shows where the heat is concentrated currently in the Pacific and the arrow indicates the approximate location of the Marshall Islands,


In a separate news item it was reported that the Marshall islands were flooded by extra high king tides. The Marshall Island in common with many other Pacific islands are very low lying and when you only have one metre of altitude for much of your living area a few extra centimetres can be critical between having dry feet or seeing your shoes float away.

Picture
This is not the first time these islands have flooded as the picture  from 2012 shows  but it does illustrate how little margin there is for safety.

Sea level is currently rising at 3.16 mm a year globally   http://climate.nasa.gov/  which to many of us is not much but if you only have 1000 mm total altitude a 500 mm sea-level rise would be critical ,then 31 mm every ten years is very serious and if you add to that extra strong trade winds to pile up the water and additional thermal expansion and you have a critical situation.

This is only a precursor for the main event and we will have to find homes for many Pacific islanders in the years ahead.


4 Comments

    Bob Bingham 

    Occasional blog posts on topical news items concerning the climate.  Please click the RSS feed to receive updates.

    Picture

    Archives

    January 2023
    November 2022
    June 2022
    May 2022
    May 2021
    May 2020
    April 2020
    March 2020
    September 2019
    December 2018
    April 2018
    March 2018
    January 2018
    December 2017
    September 2017
    June 2017
    April 2017
    March 2017
    February 2017
    January 2017
    December 2016
    November 2016
    October 2016
    August 2016
    July 2016
    June 2016
    May 2016
    April 2016
    March 2016
    February 2016
    January 2016
    December 2015
    November 2015
    October 2015
    September 2015
    August 2015
    July 2015
    June 2015
    May 2015
    April 2015
    February 2015
    January 2015
    December 2014
    November 2014
    October 2014
    September 2014
    August 2014
    July 2014
    June 2014
    May 2014
    April 2014
    March 2014
    February 2014
    September 2013
    May 2013
    April 2013
    March 2013

    RSS Feed

    Categories

    All
    Clean Water
    Climate Change.
    CO2 Levels
    El Nino
    Floods
    Methane
    Ocean Acidity
    Pine Island Galacier
    Sea Level Rise
    Soil Loss
    Storms

    RSS Feed

Proudly powered by Weebly